
Working with Inspections in nSpec
An inspection is the central unit of nSpec — it’s where you record observations, attach photos, log specimens, create action items, and generate reports. This article explains the inspection screen layout, the tabs you’ll see for different report types, and the day-to-day workflow of conducting an inspection from start to report.
Opening an Inspection
Section titled “Opening an Inspection”- Sign in to nSpec and open the sidebar (☰)
- Click Projects
- Click the project the inspection belongs to
- The Project Inspections screen shows all inspections for that project. Click the inspection you want to open
You can also reach an inspection from the dashboard’s Last Viewed Inspections card or from the My Inspections sidebar item if it’s assigned to you.
The Inspection Screen Layout
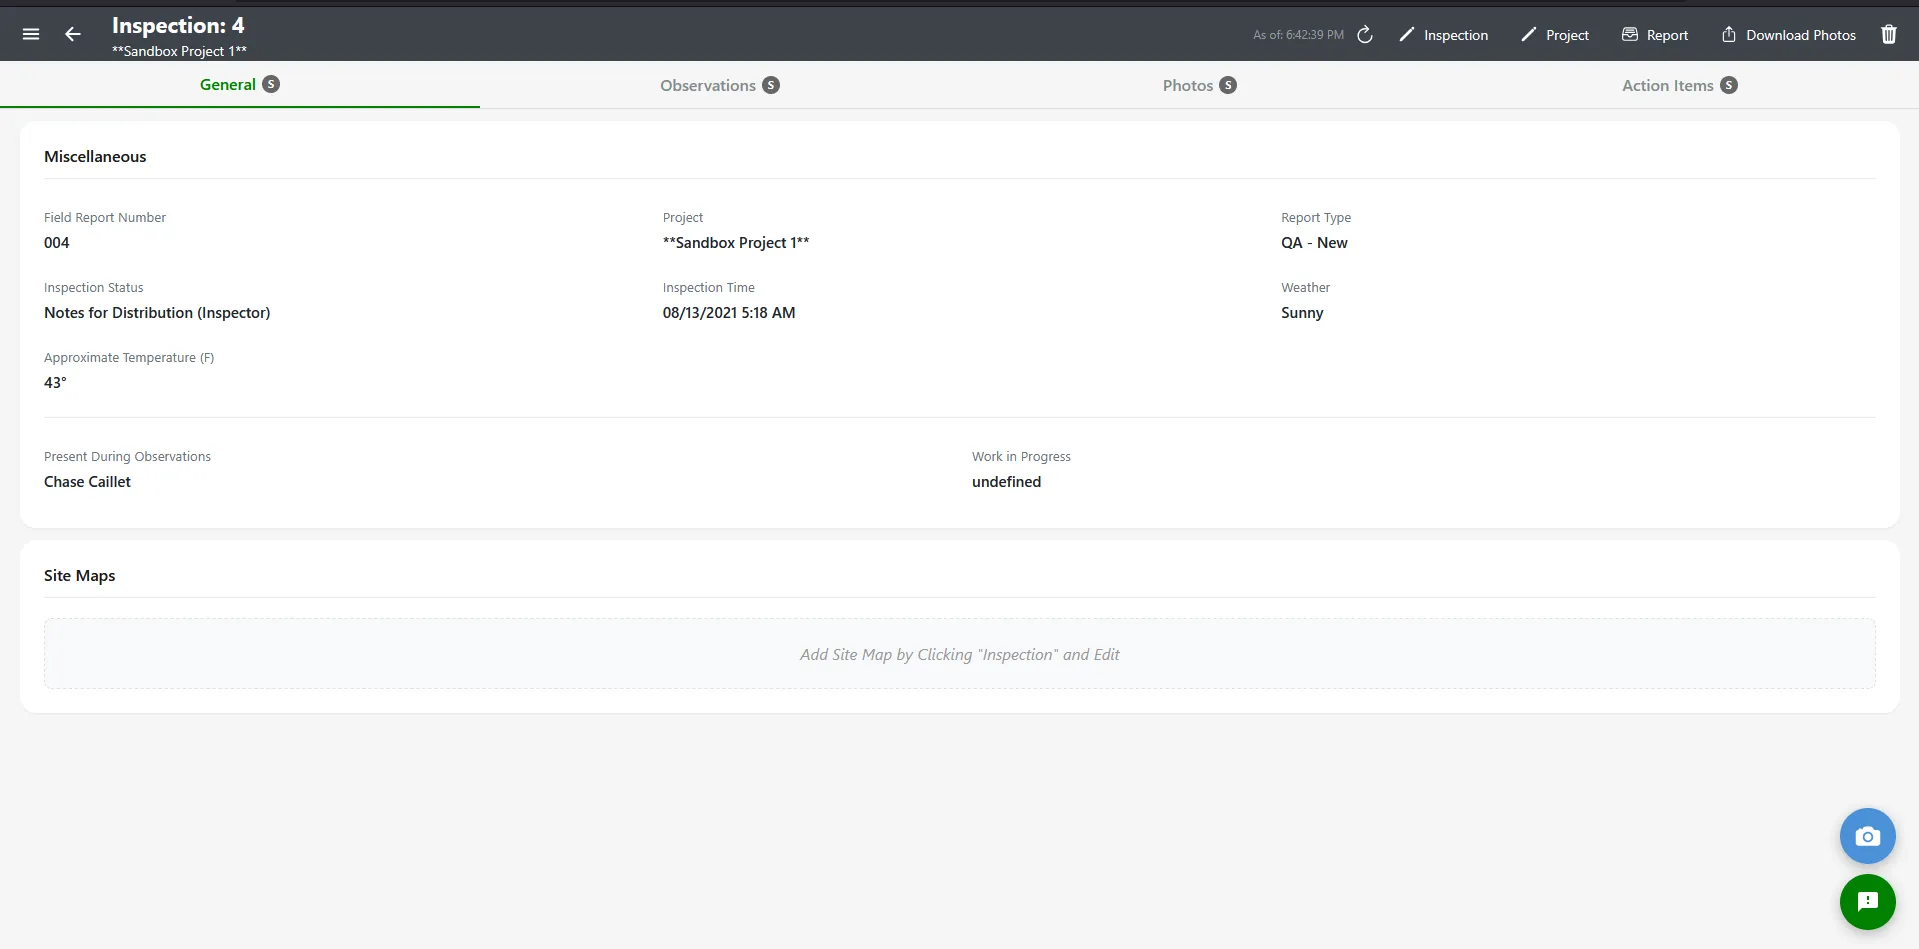
Section titled “The Inspection Screen Layout”The Single Inspection screen has a header showing the inspection number and project name, a row of tabs across the top, and the active tab content below. Click the menu icon (☰) at the top-left to open the sidebar drawer for navigation.
Tabs by Report Type
Section titled “Tabs by Report Type”The tabs you see depend on the inspection’s report type. nSpec hides irrelevant tabs so you only see what applies to the kind of report you’re building.
| Report type | Tabs available |
|---|---|
| Standard inspection | General, Observations, Photos |
| Building inspection | Instructions, General, Observations, Photos, Action Items |
| Health & Safety | General, Observations, Photos, Action Items, Checklists |
| Water Test | Test Day, General, Observations, Photos, Action Items, Tests, Recommendations, Report Content |
| Condition Survey | General, Observations, Photos, Report Content |
| Procore Compliance | Action Items only |
The General Tab
Section titled “The General Tab”The General tab is the inspection’s metadata — the information that appears on the report cover page. Most of this is set when the inspection is created and can be edited later if anything changes.
- Field Report Number — Auto-generated from the project’s Field Report Prefix
- Project — The parent project (read-only on this tab)
- Report Type — The type chosen at creation
- Inspection Date — When the inspection occurred
- Inspector — Who performed the inspection
- Supervisor — Who is supervising the project
- Inspection Status — Open, In Progress, Finished, etc.
- Weather — Conditions at the time of inspection
- Notes — Any general notes about the inspection
- Schedule Site Map / Site Map Key / Tracking Table — Reference photos that appear in the report
The Observations Tab
Section titled “The Observations Tab”Observations are the core findings of the inspection — what you saw, where you saw it, and the photos to back it up. The Observations tab has two sub-tabs: Observations for the finalized findings, and Drafts for in-progress notes that aren’t ready to be formal observations yet.
Adding an observation
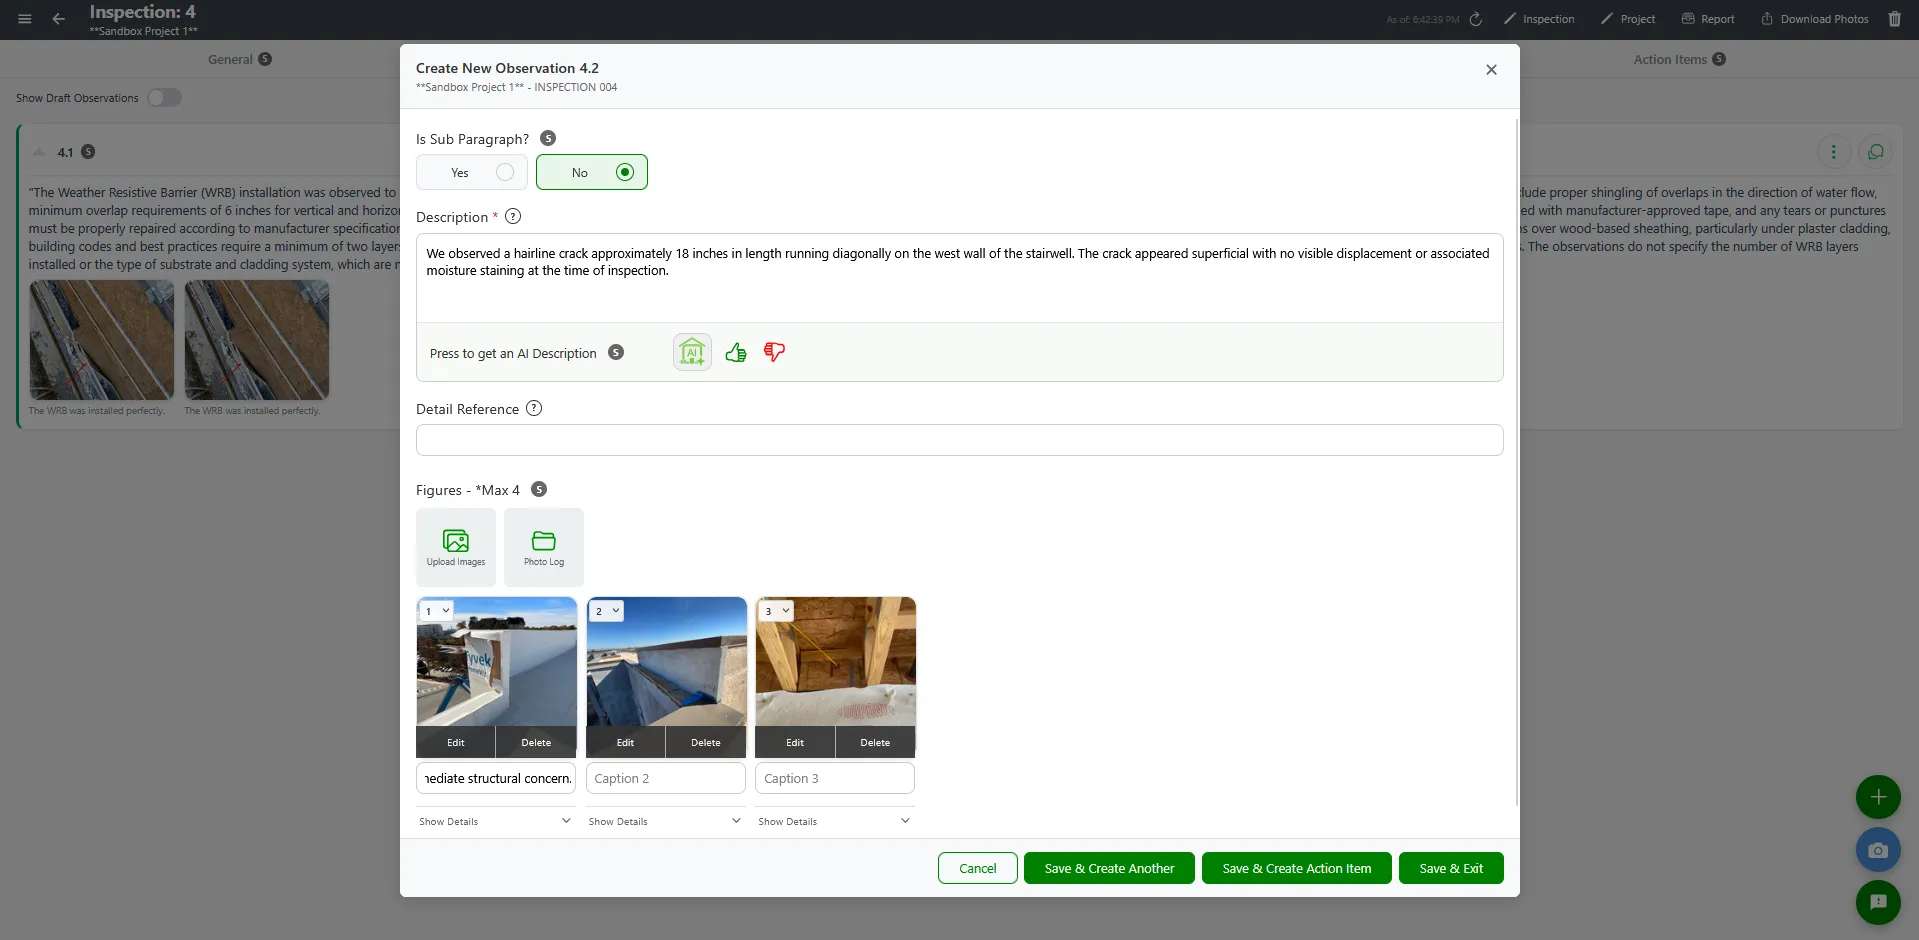
Section titled “Adding an observation”- On the Observations tab, click the + Add Observation floating action button
- The Add Observation modal opens
- Type your observation text — this is the only required field
- Add up to 4 photos with captions
- Optionally tag each photo with building, floor, elevation, and photo tags
- Click Save
Observation actions
Section titled “Observation actions”Each observation card has an action menu (three dots) with these options:
- Edit — Open the observation in the Edit modal
- Move Up / Move Down — Reorder observations within the inspection
- View Details — Expand the card inline
- Delete — Remove the observation permanently
- Collaboration Message — Send a message to collaborators about this observation
Sub-observations
Section titled “Sub-observations”Observations can have sub-observations — child findings that belong to a parent. Sub-observations appear indented with a green left border. To create one, open the Add Observation modal, check the Related checkbox, and pick the parent observation.
The Photos Tab
Section titled “The Photos Tab”The Photos tab shows every photo attached to the inspection — from observations, action items, and quick captures — in one place. Use it to review all images at once, search by caption, or take care of bulk photo work.
See Photo Organization and Tagging for the full photo workflow and Quick Capture and Batch Photos for the rapid capture flow.
The Action Items Tab
Section titled “The Action Items Tab”Action items are tasks that need to be addressed after the inspection. They’re usually tied to observations and have a status, due date, and assignee. For Procore-linked projects, action items sync to Procore as observations — see Creating Procore Observations.
Adding an action item
Section titled “Adding an action item”- On the Action Items tab, click + Add Action Item
- Fill in the description (required) and status (required)
- Optionally link to an observation, set a due date, or attach photos
- If the status is Closed (or “Closed/OC”), the Resolution field is required
- Click Save
Date coloring
Section titled “Date coloring”If the parent client has the “Add colors (green/yellow/red) to action items date?” option enabled, the action item’s due date displays in green, yellow, or red based on how soon it’s due. This helps inspectors prioritize visually.
The Specimens Tab (Water Test reports)
Section titled “The Specimens Tab (Water Test reports)”Water test inspections include a Specimens tab for recording physical samples and test readings. See Specimens and Figures for the full workflow.
The Recommendations Tab (Water Test reports)
Section titled “The Recommendations Tab (Water Test reports)”Water test reports also have a Recommendations tab for suggested fixes to issues found during the test. See Recommendations in Inspections.
The Report Content Tab
Section titled “The Report Content Tab”Some report types (Condition Survey, Water Test) include a Report Content tab where you can add custom paragraphs and sections that appear in the generated report. See Instructions and Dynamic Report Content.
The Checklists Tab (Health & Safety reports)
Section titled “The Checklists Tab (Health & Safety reports)”Health and Safety reports include checklist groups — predefined lists of items to verify during the inspection. Open the tab, expand a group, and check off each item as you go.
Generating the Report
Section titled “Generating the Report”When the inspection is complete, you can generate a PDF report directly from the inspection screen. The report runs server-side — it pulls all the data from every tab (general info, observations, photos, action items, specimens, report content, etc.) and renders it into a formatted PDF according to your report type’s template. An internet connection is required.
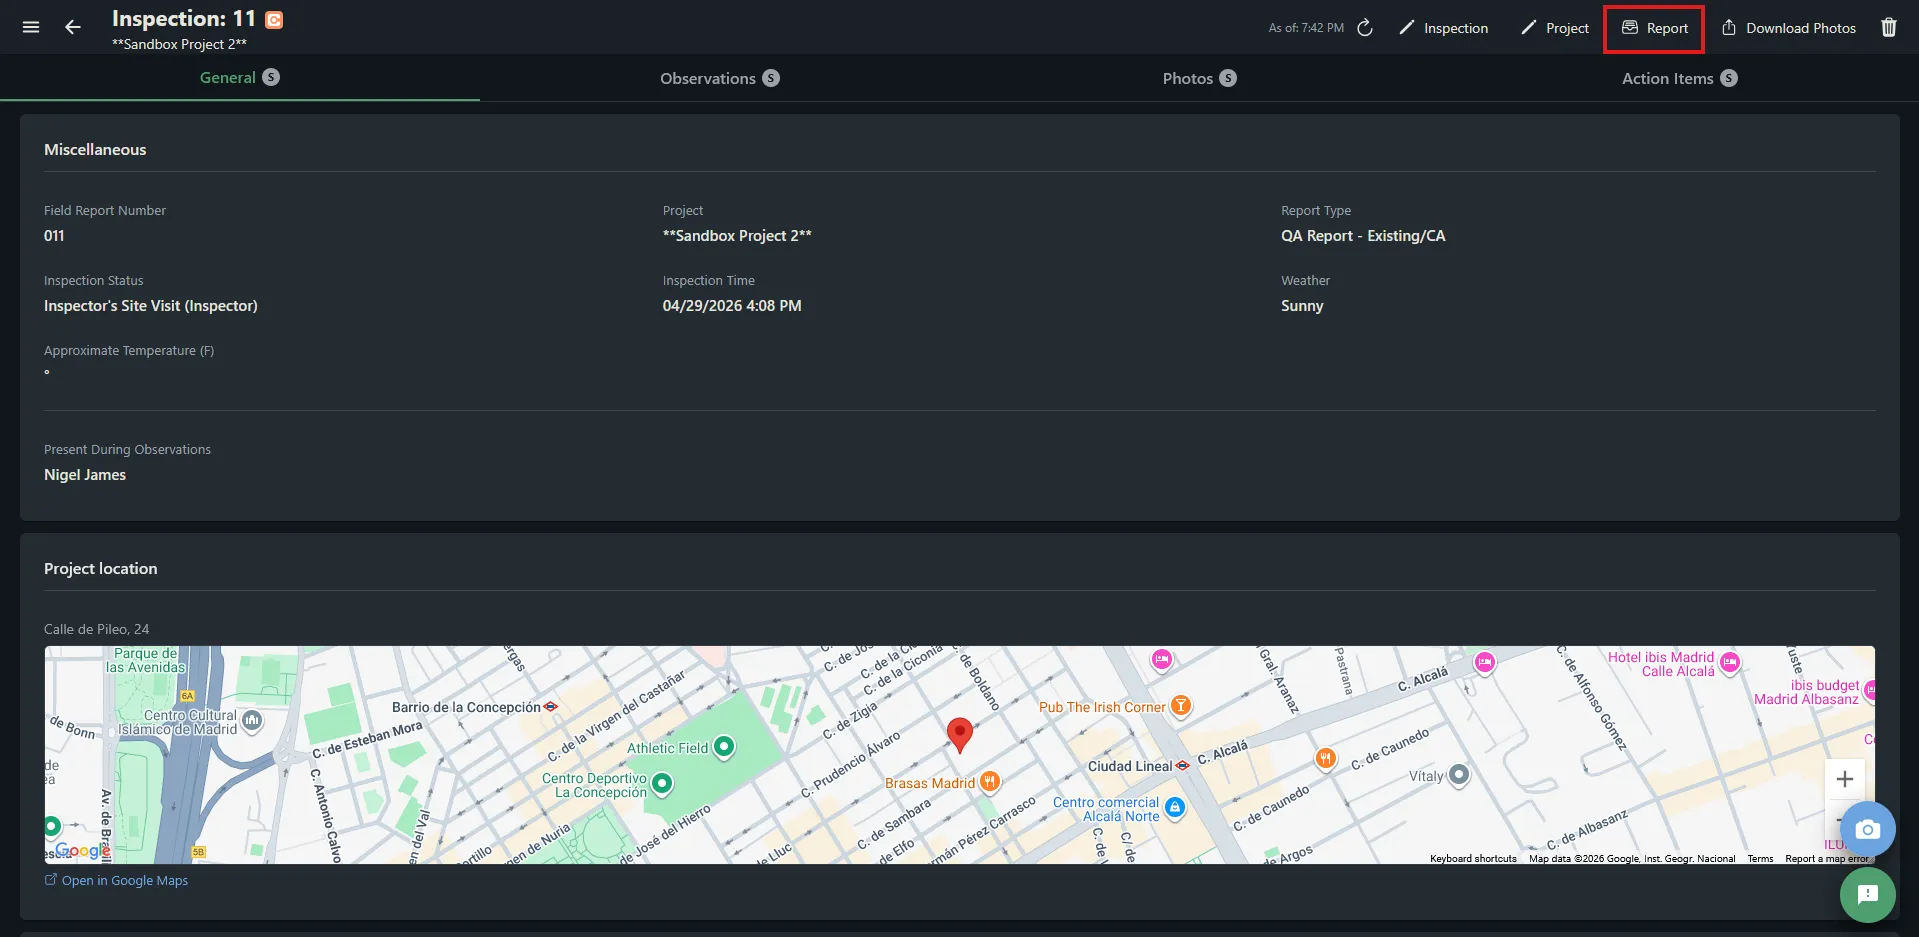
The Report Button
Section titled “The Report Button”On desktop, the Report button appears in the inspection header alongside the Inspection, Project, and Download Photos buttons. On mobile, it’s in the inspection menu (three-dot icon at the top right).
How to Generate a Report
Section titled “How to Generate a Report”- Open the inspection
- Click the Report button in the header
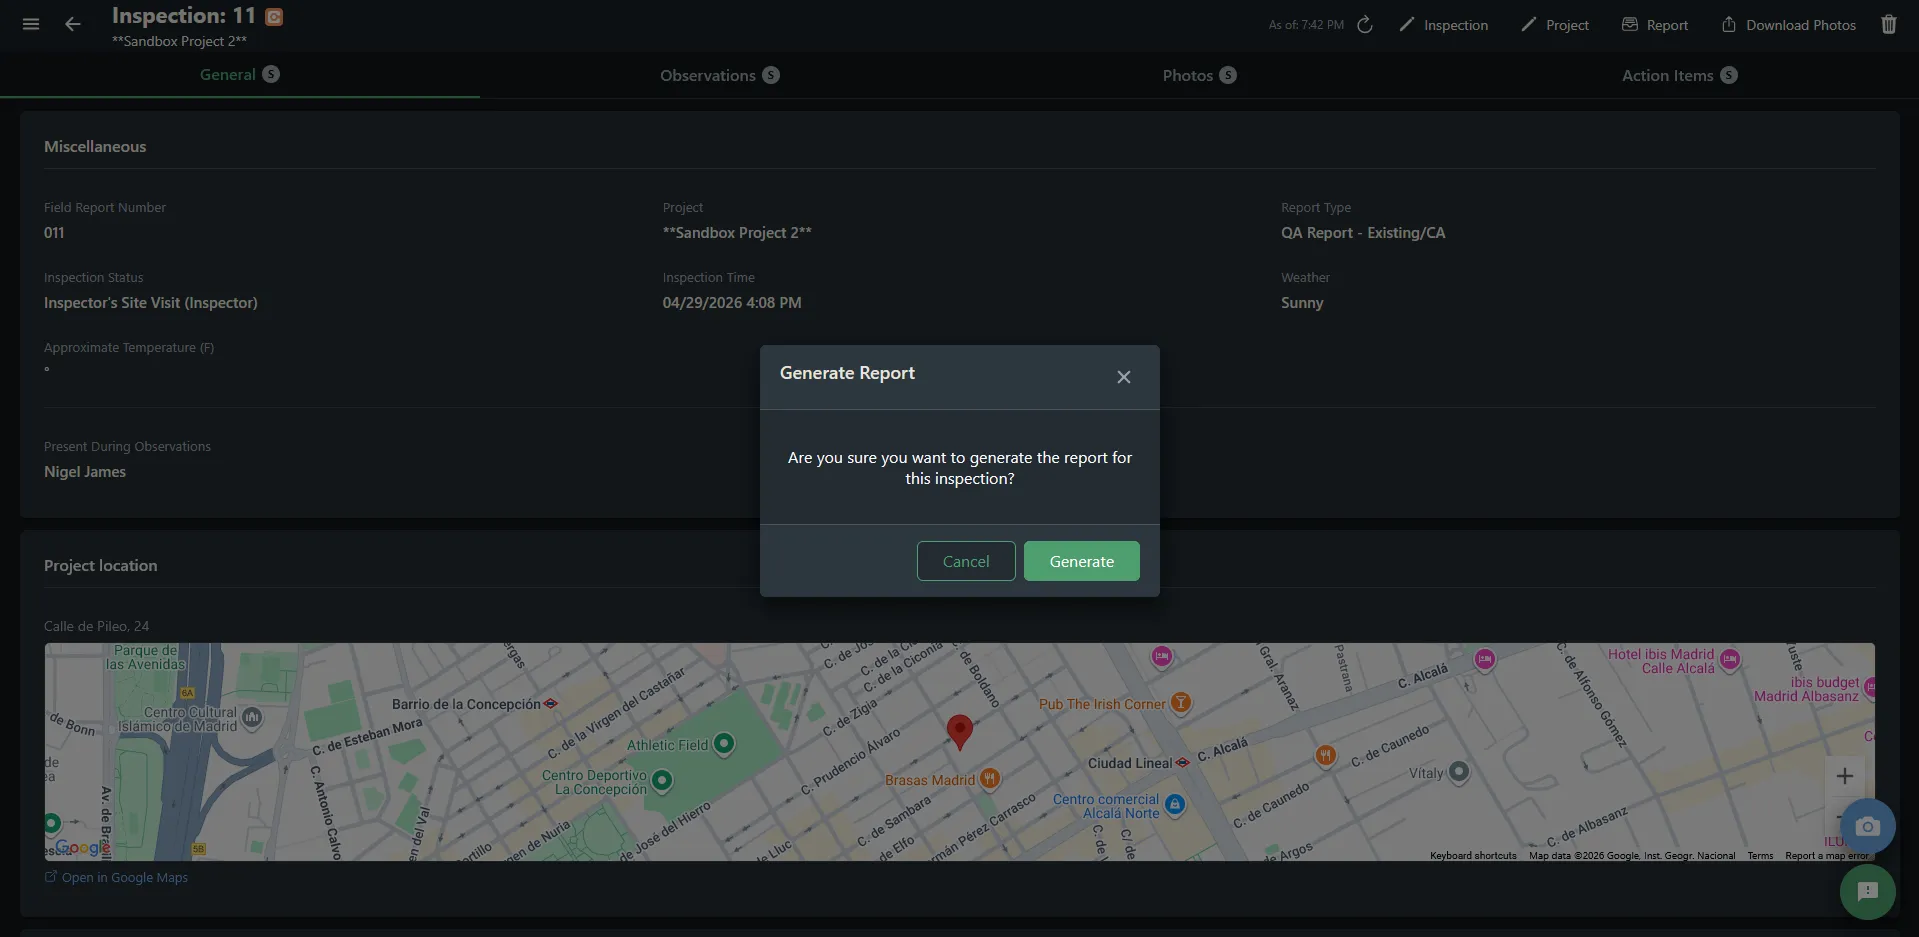
- A confirmation dialog appears: “Are you sure you want to generate the report for this inspection?” — click Generate
- The button changes to Generating… while the server builds the PDF. Do not navigate away
- When complete, the PDF downloads automatically and a “Report downloaded” toast appears
Downloaded File Names
Section titled “Downloaded File Names”The PDF file name is set automatically based on the report type:
| Report type | Downloaded file name |
|---|---|
| Standard / Building / Field inspections | BECI Field Report.pdf |
| QA Checklist | QA Checklist Report.pdf |
| Photo Log | Photo Log Report.pdf |
| Water Test / Condition Survey | BECI Water Test Report.pdf |
| Action Items | Action Items Report.pdf |
Downloading Reports in Safari
Section titled “Downloading Reports in Safari”Chrome and Safari handle PDF downloads differently:
- Chrome (desktop and Android) — The PDF downloads directly to your Downloads folder. No extra steps needed.
- Safari on macOS — The PDF may open in a browser preview tab. Click the download icon in the browser toolbar (or go to File → Save As) to save it to your computer.
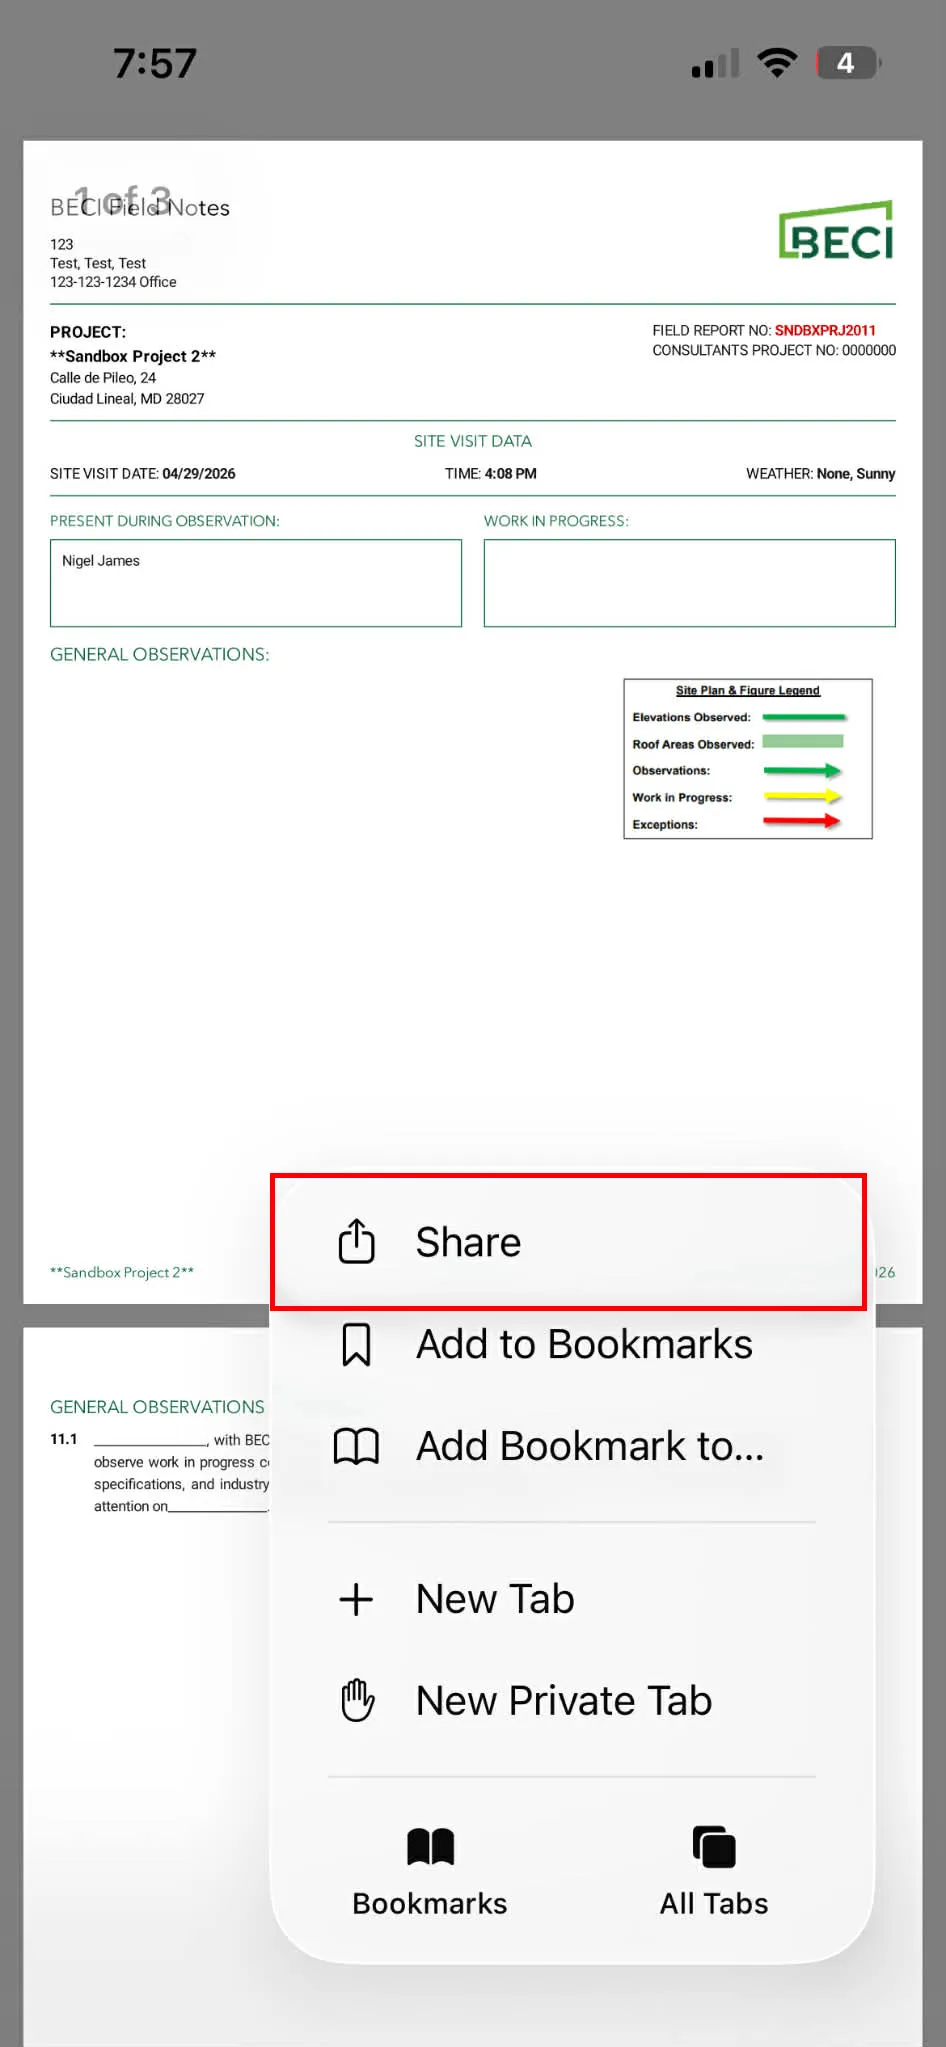
- Safari on iPad / iOS — The PDF opens in the browser instead of downloading. Tap the Share button (box with an arrow) at the top of the screen, then tap Save to Files and choose a location.
Downloading All Inspection Photos
Section titled “Downloading All Inspection Photos”The Download Photos button (in the inspection header, next to Report) does not download photos directly. Clicking it copies a download link to your clipboard. Open a new browser tab, paste the link, and press Enter to start the download.
See Understanding nSpec Report Types for the differences between report templates.
Collaboration Messages
Section titled “Collaboration Messages”Every observation, action item, specimen, recommendation, and report content item has a green chat-bubble button that opens a threaded conversation attached to that item. Use it to coordinate with client collaborators and team members on specific findings. Unread messages appear on the dashboard’s Unread Collaboration Messages card.
For the complete guide — entry points, sending messages, attaching images, read status, and best practices — see Collaboration Messages.
Saving Your Work
Section titled “Saving Your Work”Inspections save when you click Save in any modal (add or edit) — there’s no general “Save Inspection” button because each item is saved individually as you go. If you’re working offline, your changes are saved to your browser’s offline cache and synced later via the Offline Hub. See Offline Hub Guide.
Troubleshooting
Section titled “Troubleshooting”Some tabs are missing from my inspection
Section titled “Some tabs are missing from my inspection”Solutions:
- Tabs depend on the report type. A standard inspection only shows General, Observations, and Photos. Tests, Specimens, Checklists, and Report Content only appear on specific report types.
- If you need a different set of tabs, you may need to create the inspection with a different report type
Save button doesn’t work in Add Observation
Section titled “Save button doesn’t work in Add Observation”Solutions:
- The Observation Text field is required. Make sure you’ve typed something.
- If photos are still uploading, wait for them to finish before saving
Report generation failed or timed out
Section titled “Report generation failed or timed out”Solutions:
- Check your internet connection — report generation runs server-side and requires a stable connection
- Large inspections with many photos can take up to 60 seconds — wait for the Generating… state to resolve before trying again
- If it times out, try again — there is no partial state left on the server, so retrying is safe
- See Report Generation Issues for more help
The report opened in my browser instead of downloading (Safari)
Section titled “The report opened in my browser instead of downloading (Safari)”Solutions:
- macOS Safari — Click the download icon in the browser toolbar, or use File → Save As
- iPad / iOS Safari — Tap the Share button (box with arrow icon) at the top of the screen, then tap Save to Files
- This is expected Safari behavior — the PDF is fully generated, it just opens in-browser instead of downloading automatically