
Admin Chat and Message Analysis
Admin Chat and Message Analysis give administrators deep visibility into how the AI processes each message. Admin Chat works the same way as the regular Chat Interface but with additional diagnostic tools. Message Analysis lets you drill into any individual message to see the full execution timeline, token breakdown, cache performance, and model reasoning.
Admin Chat
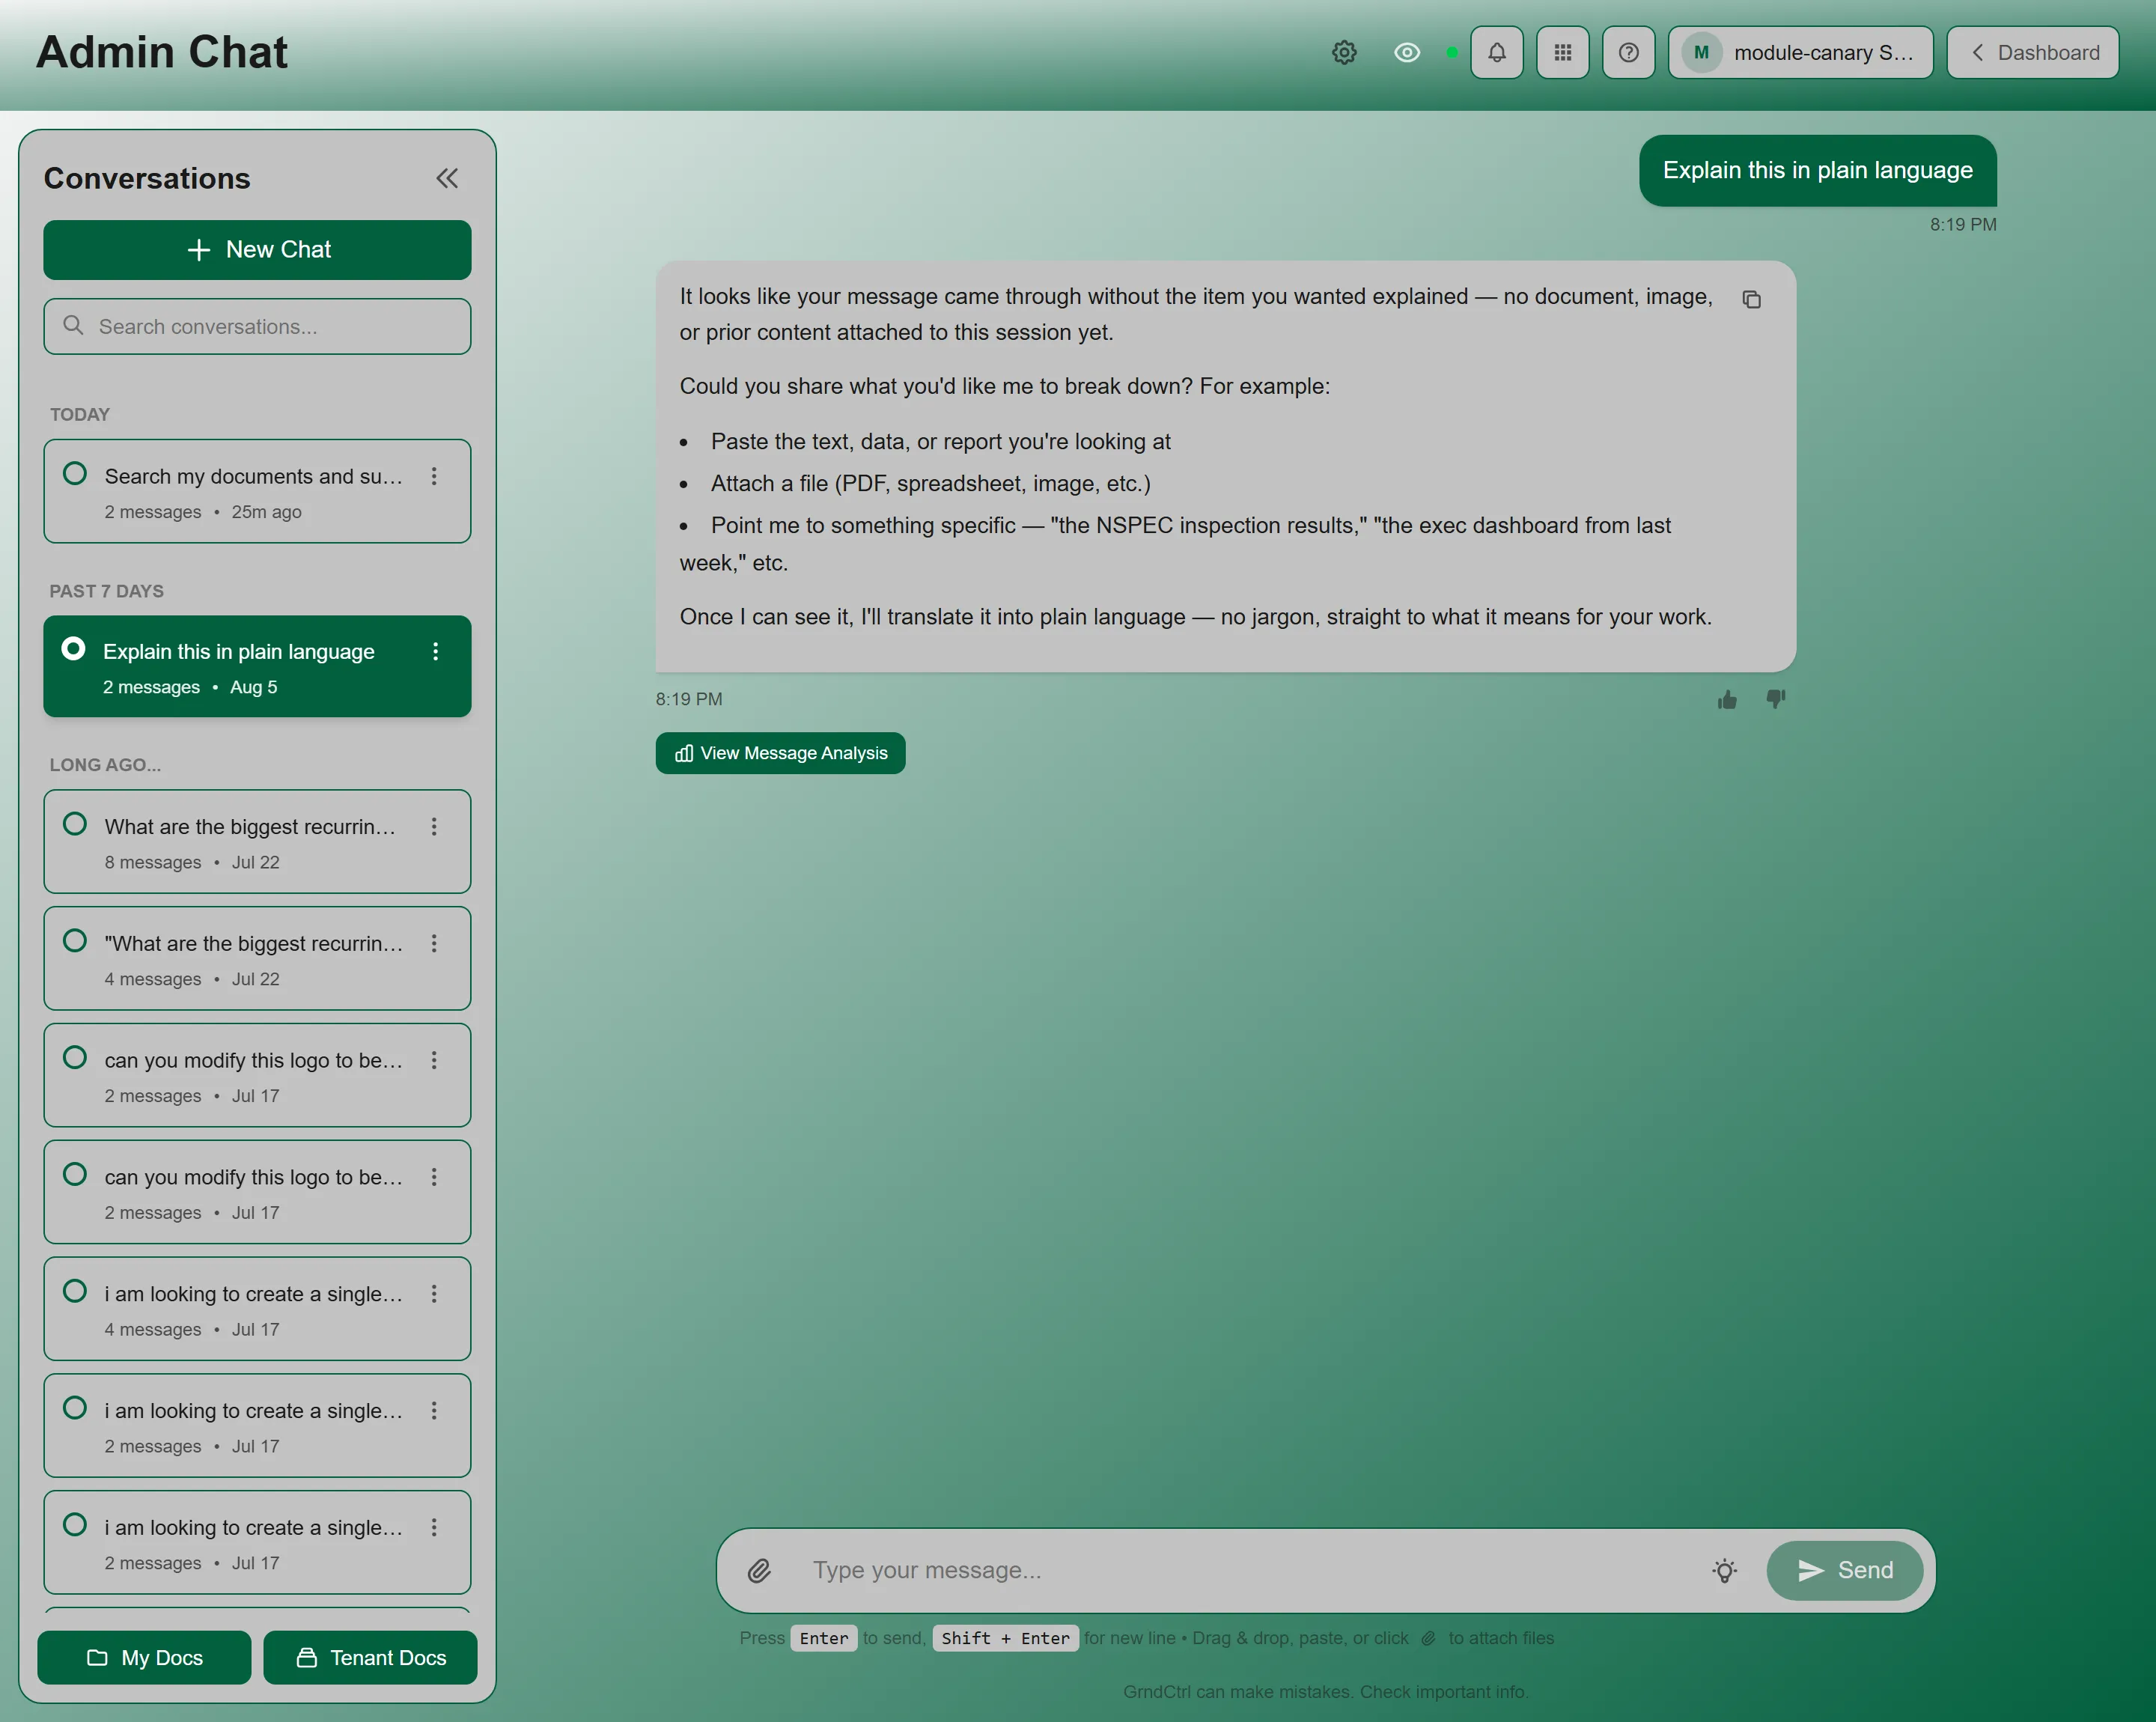
Section titled “Admin Chat”Admin Chat is identical to the regular Chat Interface with one key addition: a View Message Analysis button on each AI response. This button opens Message Analysis for that specific message, showing you exactly what the AI saw and did.
Admin Chat also provides:
- Access to both My Documents and Document Library libraries
- Full conversation search across all tenant conversations
- All the same tools, Extended Thinking, and preferences as regular chat
Message Analysis
Section titled “Message Analysis”Message Analysis is an LLM observability dashboard that shows everything the AI model saw and did during message processing.
How to Access
Section titled “How to Access”- From Admin Chat — click View Message Analysis on any AI response
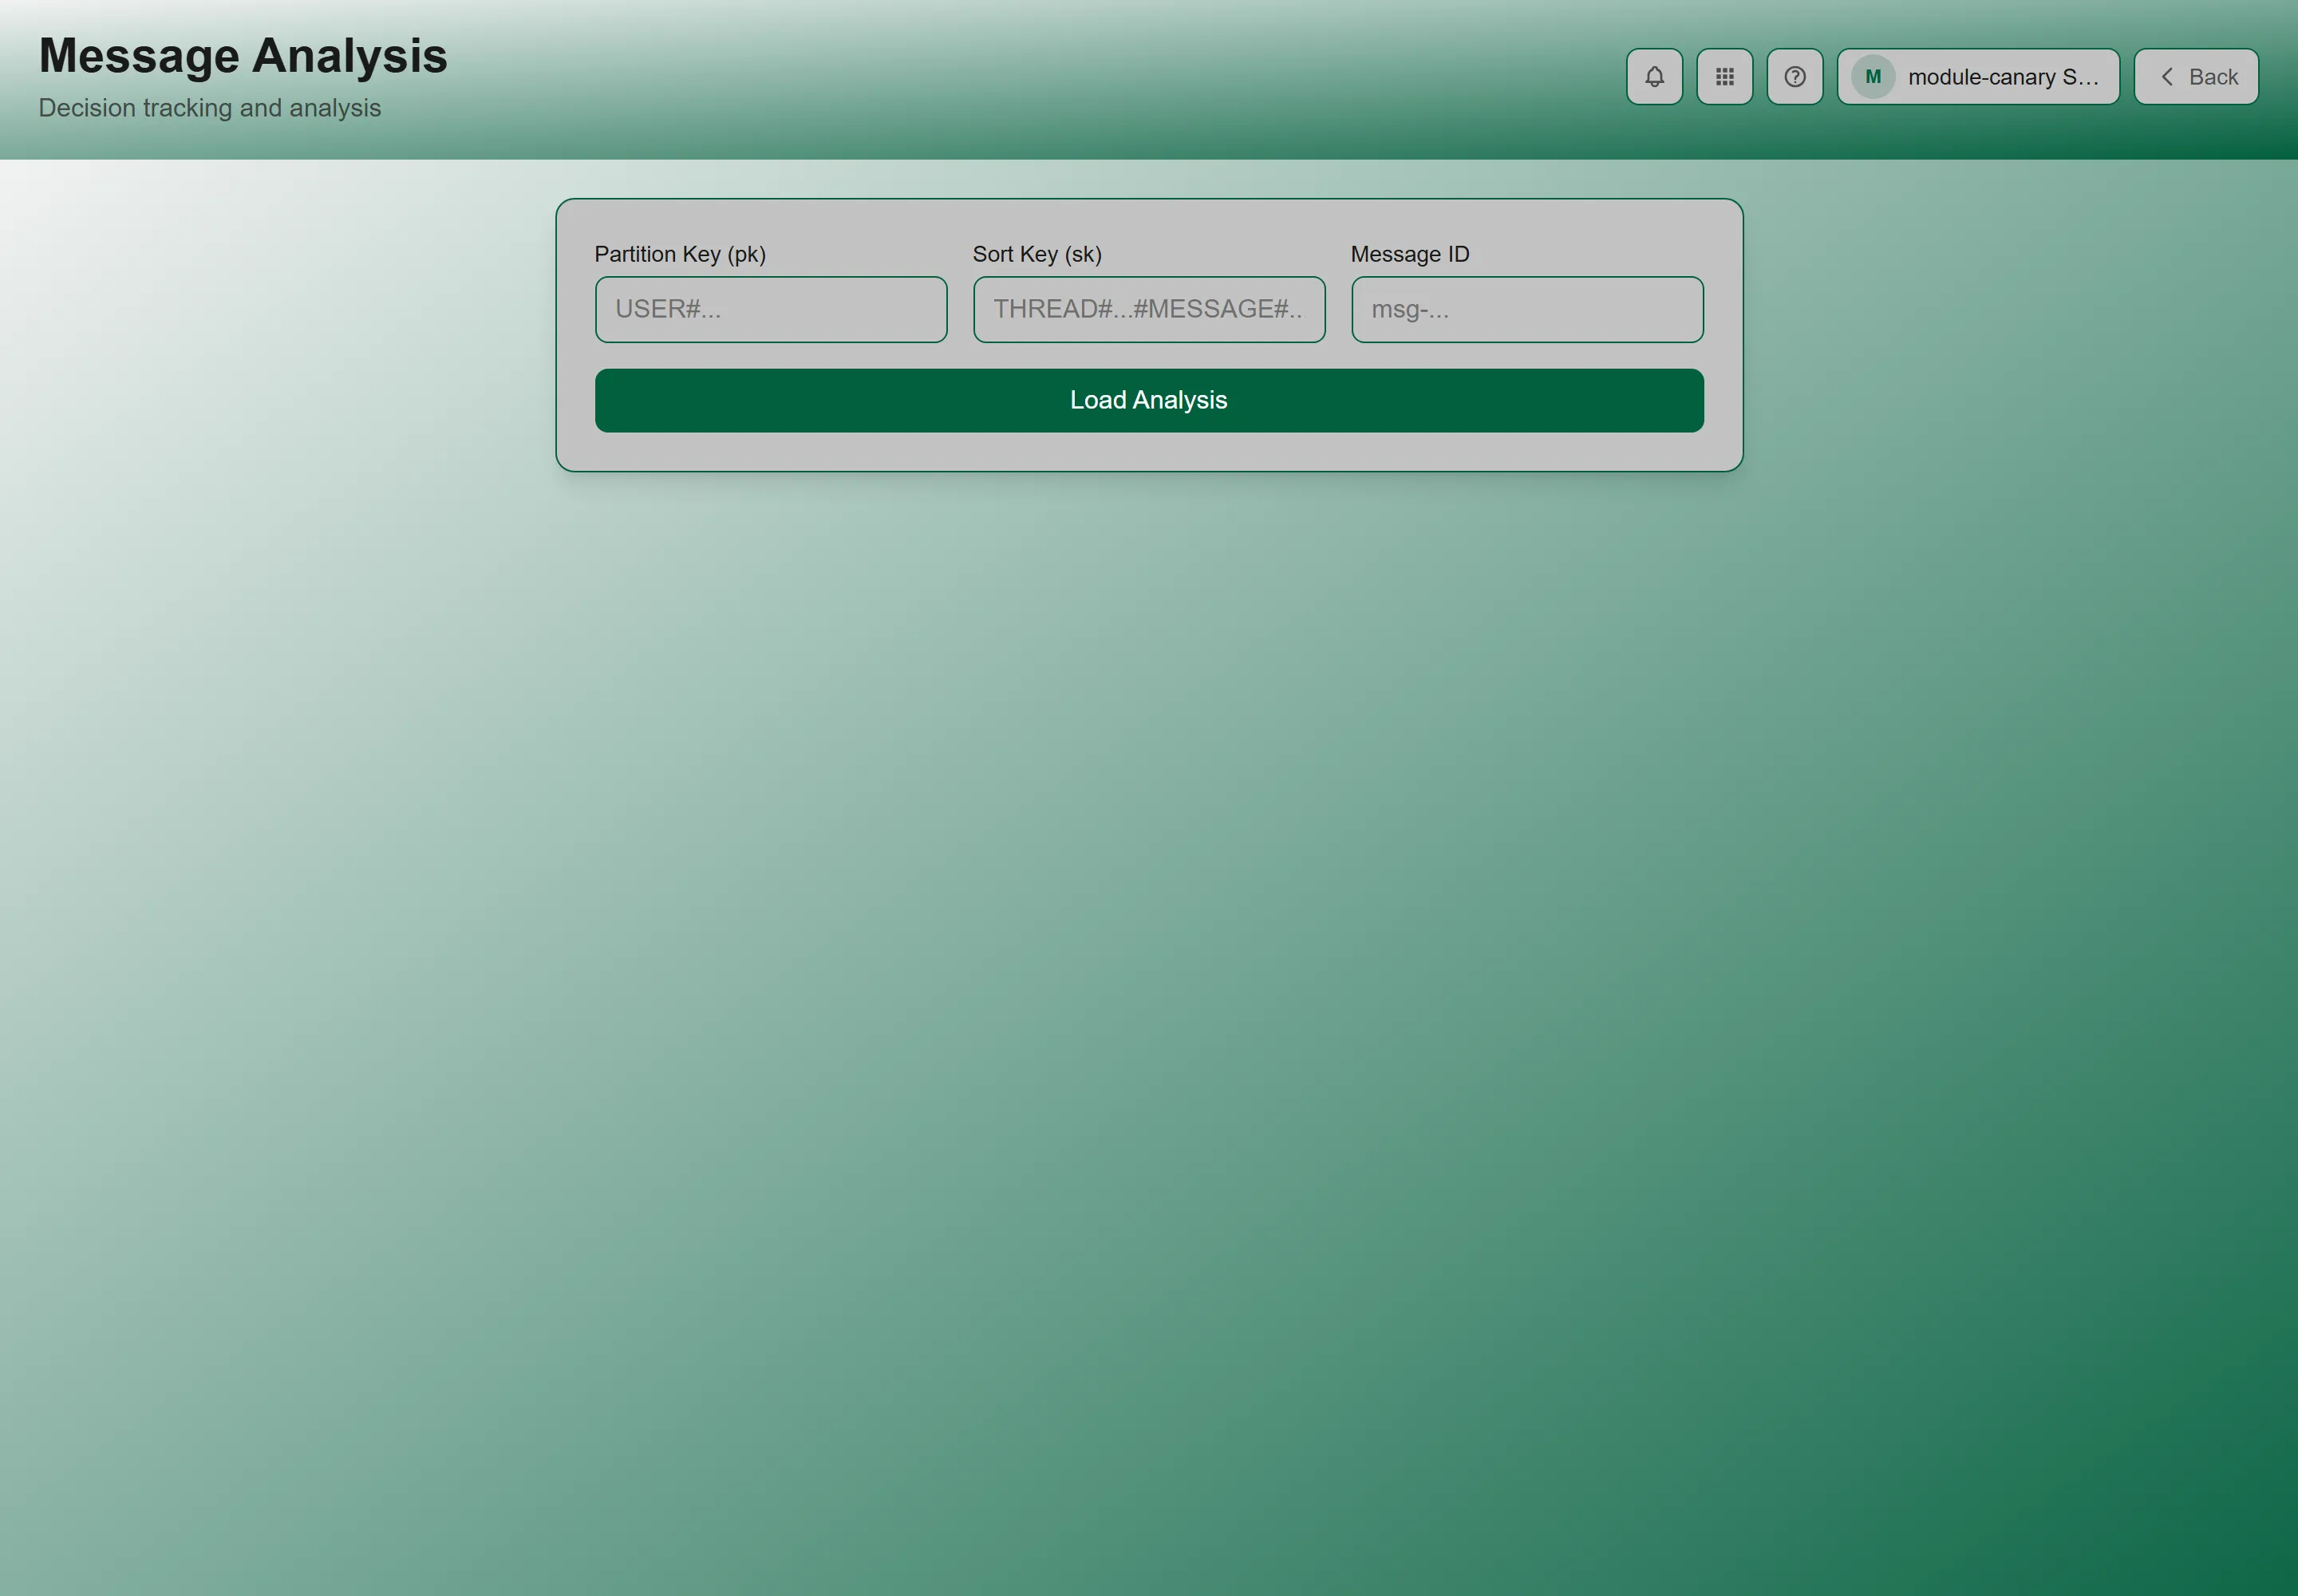
- Direct URL — navigate to Message Analysis and enter the partition key (pk), sort key (sk), or message ID
Query Form
Section titled “Query Form”If accessing directly, enter at least one of:
- Partition Key (pk) — format:
USER#... - Sort Key (sk) — format:
THREAD#...#MESSAGE#... - Message ID — format:
msg-...
Click Load Analysis to fetch the data.
Summary Statistics
Section titled “Summary Statistics”Five KPI cards appear at the top of the analysis:
| Card | What It Shows |
|---|---|
| Model | Which AI model processed the message. Recent messages show Sonnet 5, Opus 4.8, or Haiku 4.5; older messages keep the name of the model that actually ran them, so you will also see earlier names such as Sonnet 4.6 or Opus 4.5 |
| Duration | Total processing time in seconds |
| Total Tokens | Total token count (clickable — expands the Token Breakdown section) |
| Cache Status | Green “Hit” (tokens read from cache — 90% cost reduction), Blue “Write” (tokens written to cache), or Gray “No cache” |
| Steps | Number of execution steps the model took |
Token Breakdown
Section titled “Token Breakdown”Click the Total Tokens card to expand the breakdown. It shows a two-column comparison:
Cached Content (left column, green)
Section titled “Cached Content (left column, green)”Content that stays the same across messages and can be cached for cost savings:
- Base Template — the system prompt template
- Tenant Policies — your organization’s AI policies
- Profile Memory — user context and preferences
- Roadmap — conversation planning data
- Tool Definitions — definitions of available tools
If a cache hit occurred, a note shows: “Anthropic cache hit: X tokens (90% cost reduction)”.
Dynamic Content (right column, orange)
Section titled “Dynamic Content (right column, orange)”Content that changes each turn and is billed at full rate:
- Session Info — current session metadata
- Recent Messages — last few messages in the conversation
- Older Messages — earlier conversation history
- Current Message — the user’s latest message
- Tool Results — data returned by tools (shown with per-tool token counts)
Execution Timeline
Section titled “Execution Timeline”Below the token breakdown, the execution timeline shows a chronological list of every step the model took. Each step is expandable and shows:
- Turn number and action type (
tool_callorresponse) - Duration in milliseconds (and Time to First Token if available)
- Tools called (if applicable)
- Token usage per turn: input, output, cache read, cache creation
- Stop reason
- Response preview (truncated)
Trace ID
Section titled “Trace ID”A Trace ID is shown for each analysis. Click the copy button to copy it — this ID can be used in CloudWatch Logs Insights for deeper backend debugging:
filter @message like 'trace-xxx'
PDF Jobs Panel
Section titled “PDF Jobs Panel”If the conversation involved PDF generation, a panel shows all PDF jobs with:
- Status badge — color-coded (pending, processing, complete, failed)
- Mode — Generated or Refined
- Document title and version
- Page count and progress
- Processing timeline — Created, Build, Design, Render, Validation phases with duration for each
- Metadata — Job ID, Document Type, File Size, S3 location
Troubleshooting
Section titled “Troubleshooting”Load Analysis returns no data
Section titled “Load Analysis returns no data”Solutions:
- Make sure at least one field (pk, sk, or message_id) is filled in
- Verify the IDs are correct — you can get them from the Admin Chat View Message Analysis button
- Very old messages may have expired from the analysis store
Cache Status shows “No cache”
Section titled “Cache Status shows “No cache””Solutions:
- Cache hits depend on conversation context staying consistent
- The first message in a new conversation always shows “Write” (creating cache)
- Subsequent messages in the same conversation should show “Hit”